
 3 MIN READ
 UPDATED NOV 4, 2026
For company admins, finance admins and approvers on Toku Employment. Last updated November 4, 2026.
The Analytics view on the Expenses page shows where your company's expense money goes: how much was spent over a period, how that compares with the period before, what is still waiting for approval, and how spend splits by month, by category, by person and by country. From any category or person you can jump straight to the matching expense reports.
Before you start
- You need access to the Expenses page as a company admin, a finance admin or an approver.
- Approvers see the reports of the people they review, not their own. Admins with a team scope see the reports of their team.
- Spend counts every expense in a report that is submitted, waiting for information or approved, by the date the expense was spent. Drafts, rejected and cancelled reports do not count.
- Amounts are shown in one currency at a time. Spend in different currencies is never added together or converted.
Open the Analytics view
- In the left menu, under Finance, select Expenses. Approvers select Expenses, then the Team approvals tab.
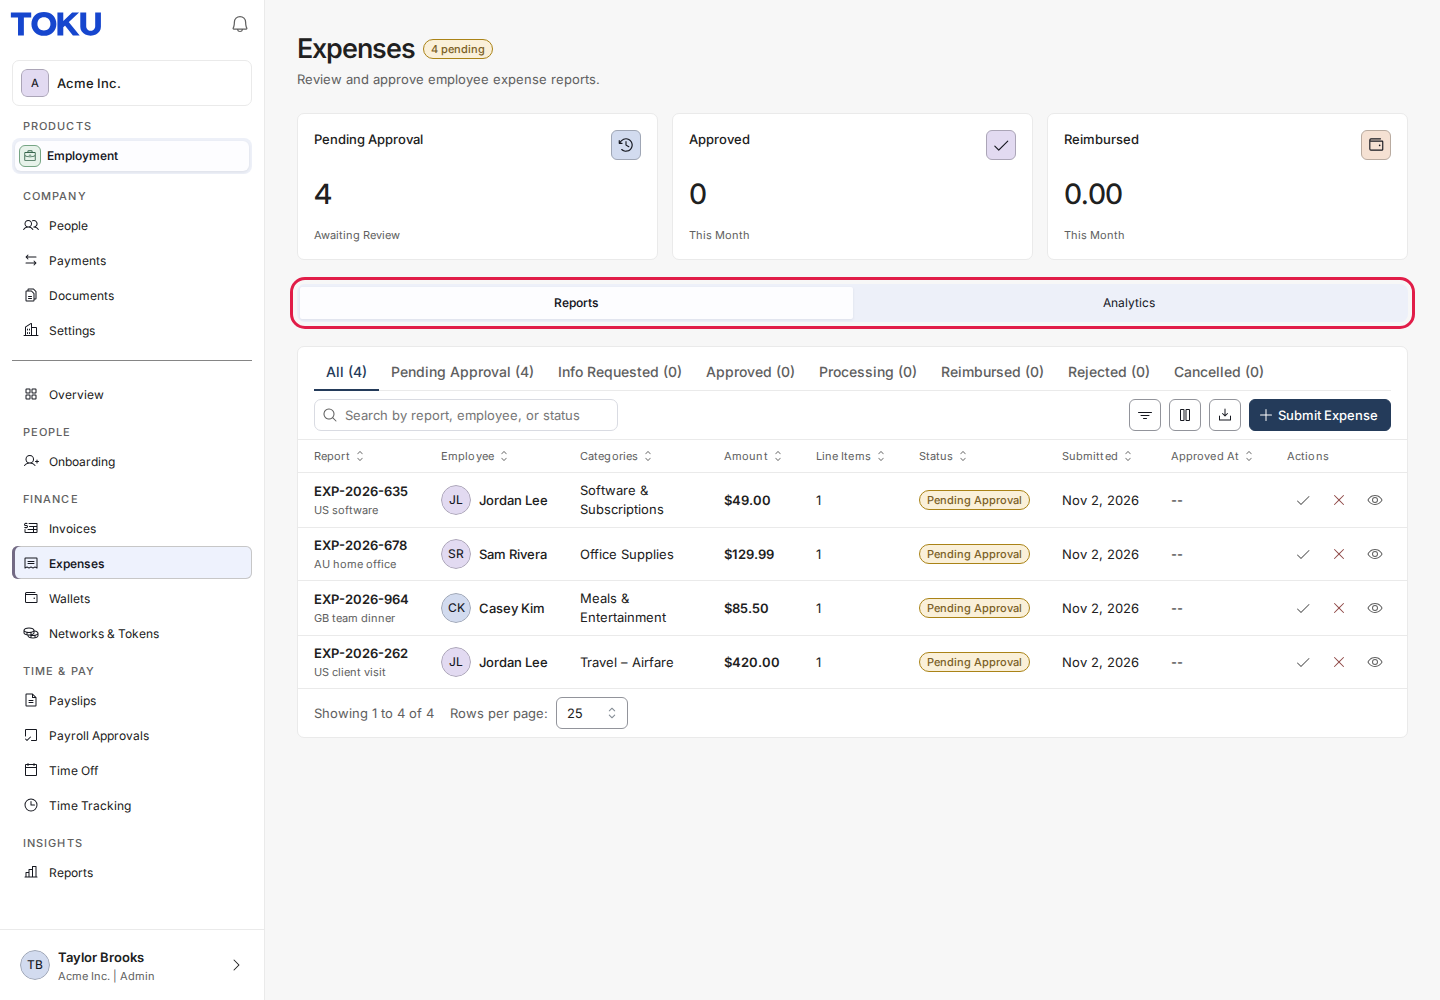
- Under the summary cards, select Analytics. The Reports side of the same switch takes you back to the list of expense reports.
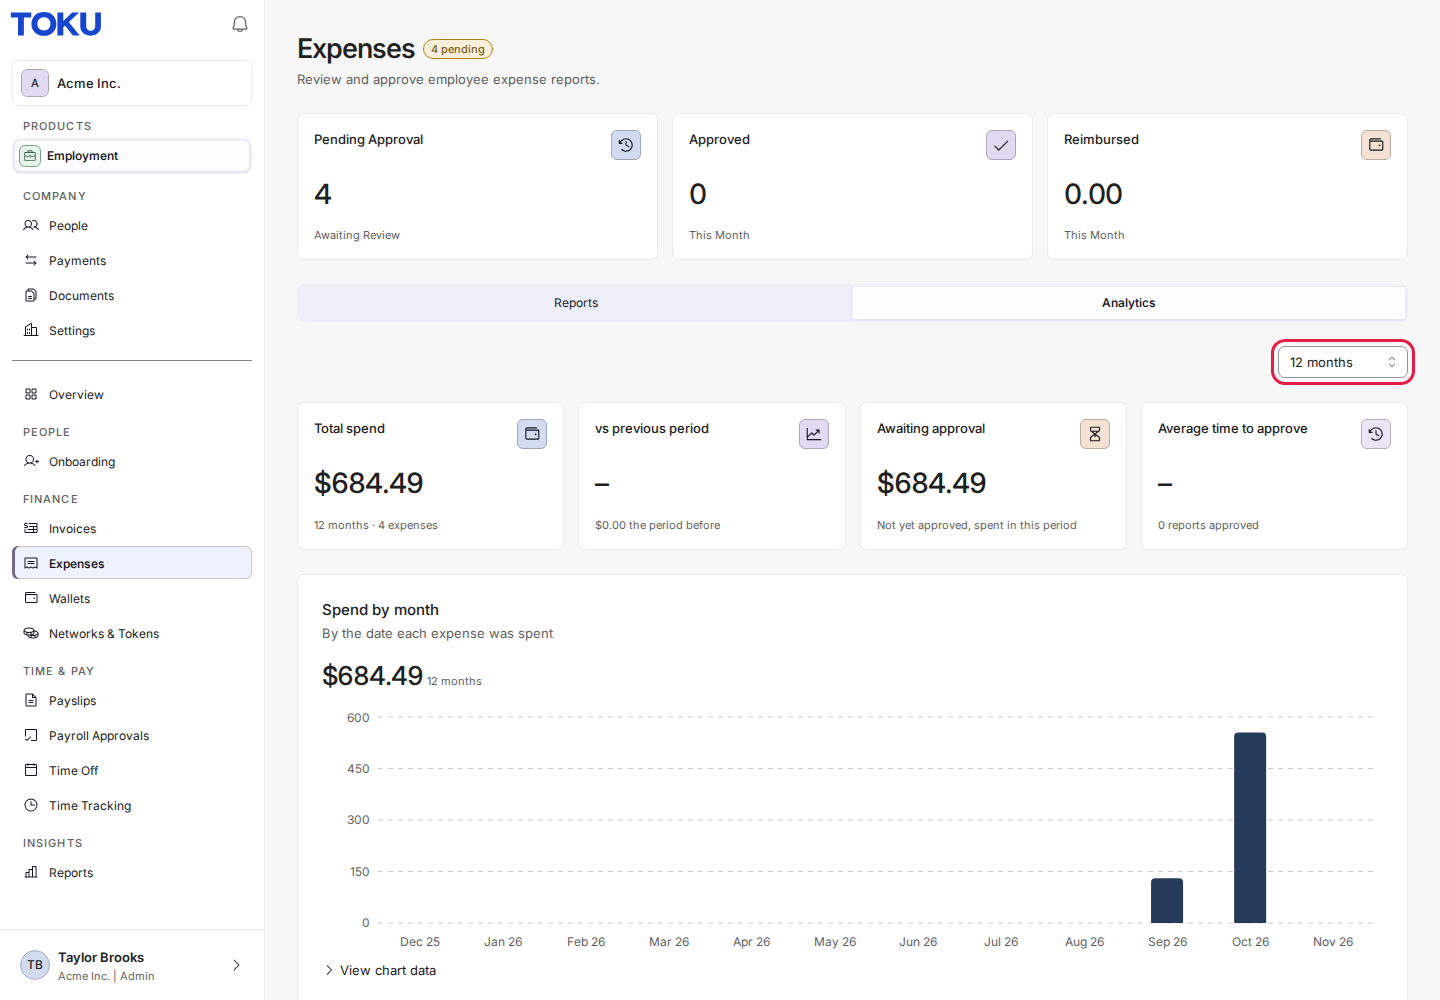
- Pick the period in the top right: 12 months, This year, Last year or 3 months. If your team spent in more than one currency in that period, a currency picker appears next to it.
Read the figures
The four cards at the top show:
- Total spend: everything spent in the period, with the number of expenses.
- vs previous period: the change from the period before. This year is compared with the same months last year.
- Awaiting approval: spend in the period that is not approved yet.
- Average time to approve: how long approvals took for reports approved in the period. Reports approved automatically when they were submitted are left out. Spend by month charts the period month by month. Select View chart data under the chart to see the same figures as a table.
See spend by category, person and country
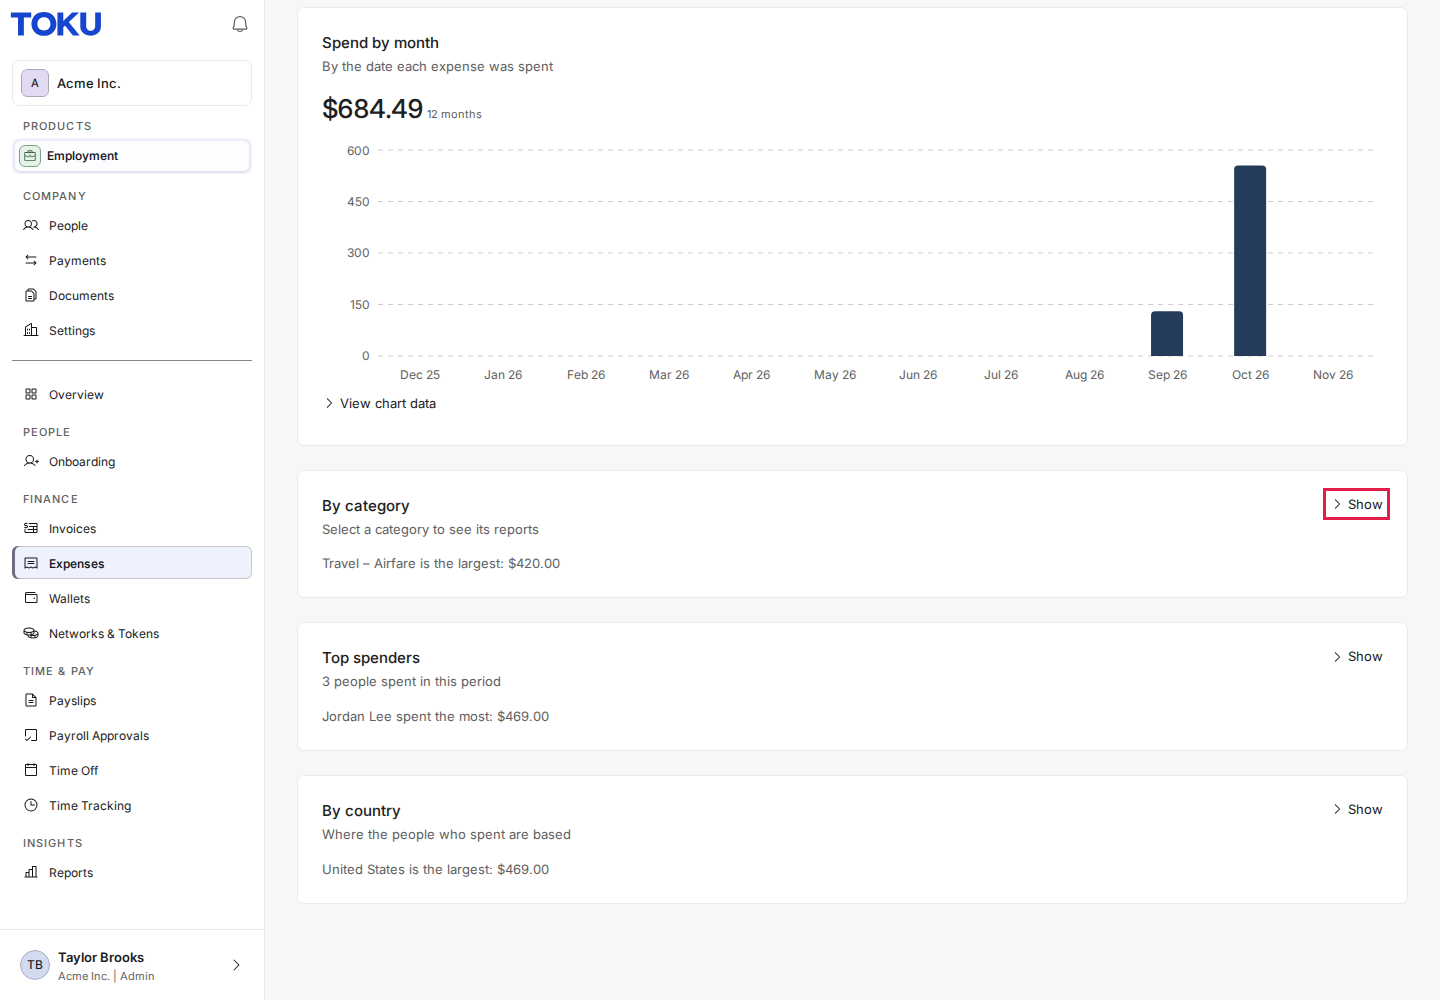
By category, Top spenders and By country open collapsed, each with a one-line summary of its largest item.
- Select Show next to the breakdown you want to see.
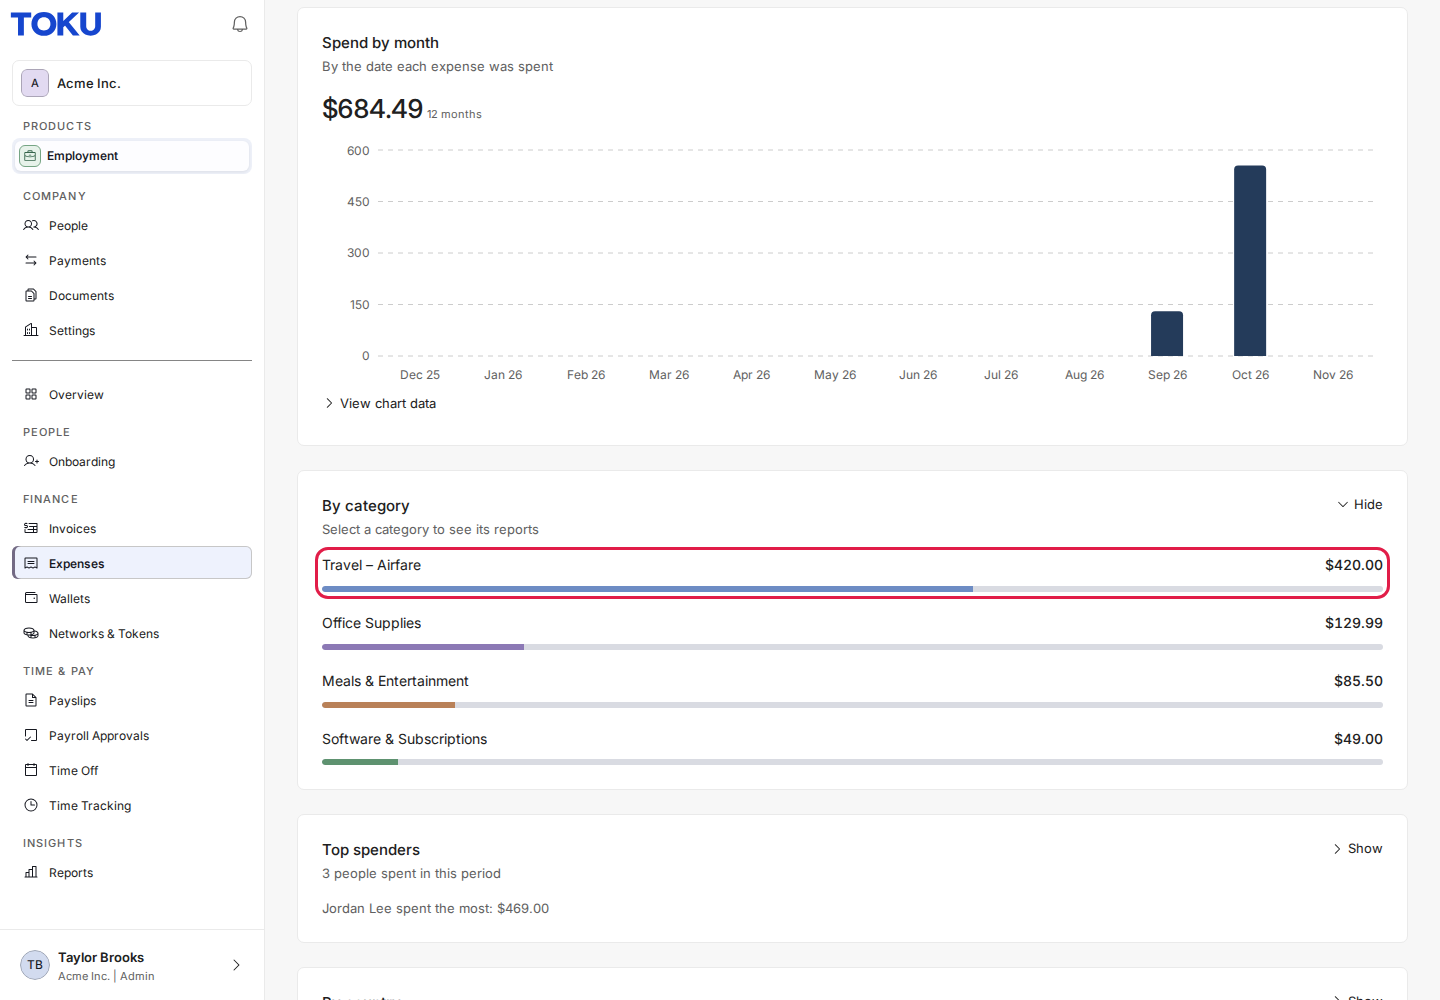
- The full list opens, largest first. Top spenders lists the ten people who spent the most. Select Hide to collapse it again.
Open the reports behind a figure
- Select a category under By category, or a person under Top spenders.
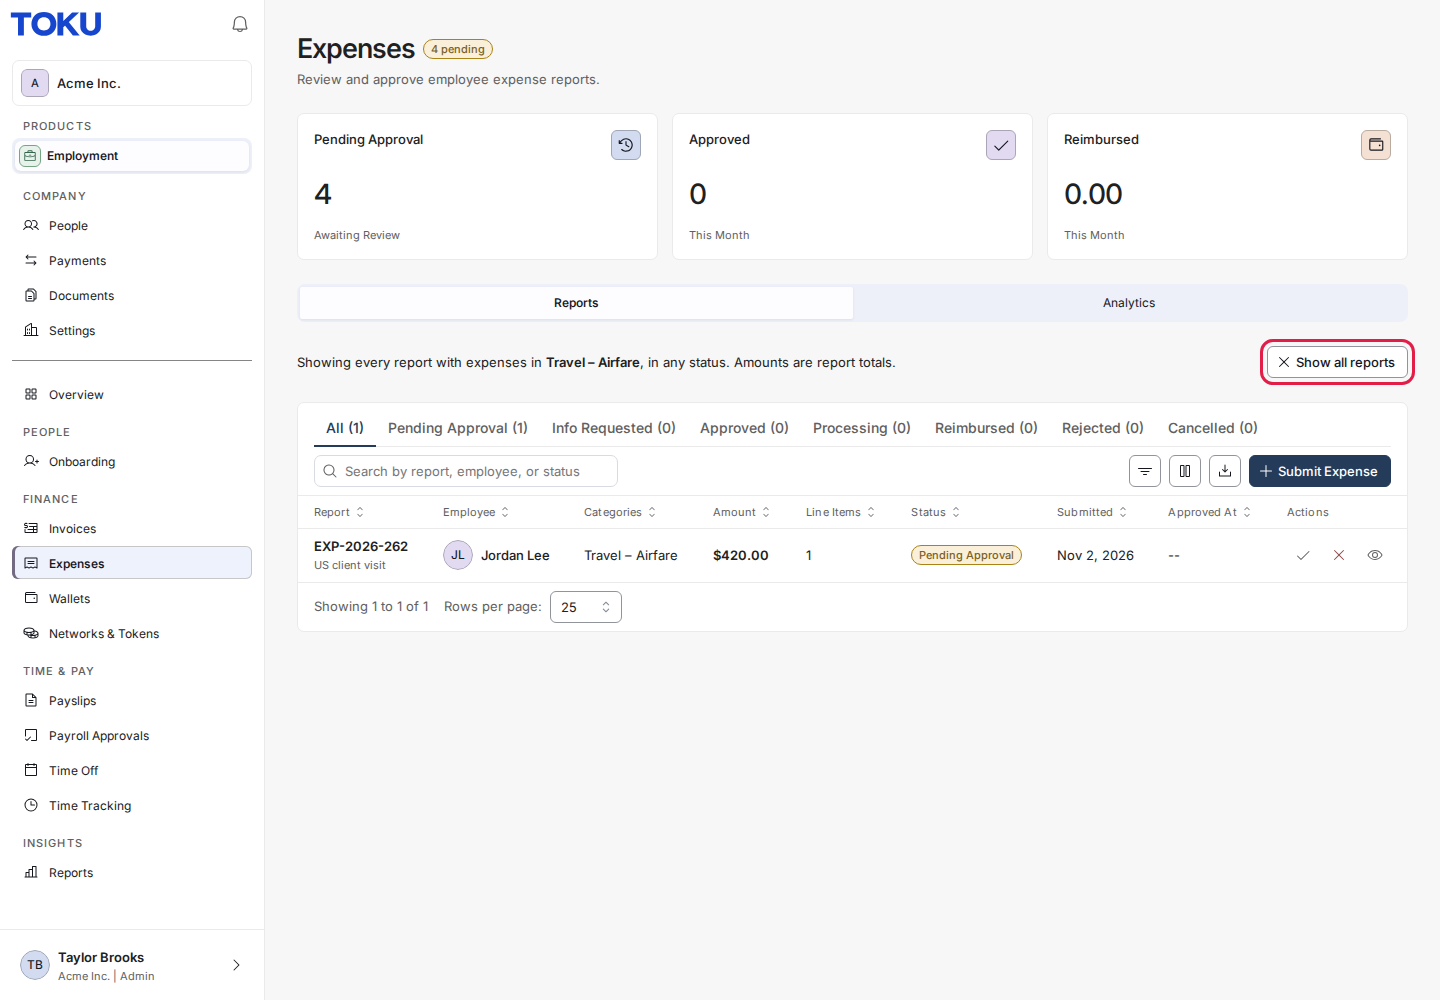
- The Reports view opens with only the matching expense reports, in any status. The amounts in the list are report totals, so a report with expenses in several categories shows its full total.
- Select Show all reports to see every report again. If you export the list while it is filtered, the export contains only the reports shown.
Good to know
- Each currency is shown on its own because spend is not converted between currencies. Use the currency picker to switch.
- Expenses without a category are counted under Uncategorized. That line can't be selected to filter the list.
- People without a country on their profile are counted under Country not set.
- If a period has a very large number of expenses, the page asks you to choose a shorter period.
Still stuck?
Email [email protected] and tell us which period and currency you were looking at.