
 5 MIN READ
 UPDATED OCT 30, 2026
📘 For organization administrators, employees, and contractors on Toku. Last updated October 30, 2026.
Toku has a public status page: status.toku.com
It shows, in real time, whether the Toku platform is working normally. It checks the platform automatically every 3 minutes, around the clock. If something breaks, the page shows it, usually before anyone needs to report it. You do not need to log in to see it.
When to use it: any time the app feels slow, a page will not load, or someone cannot log in, check this page first.
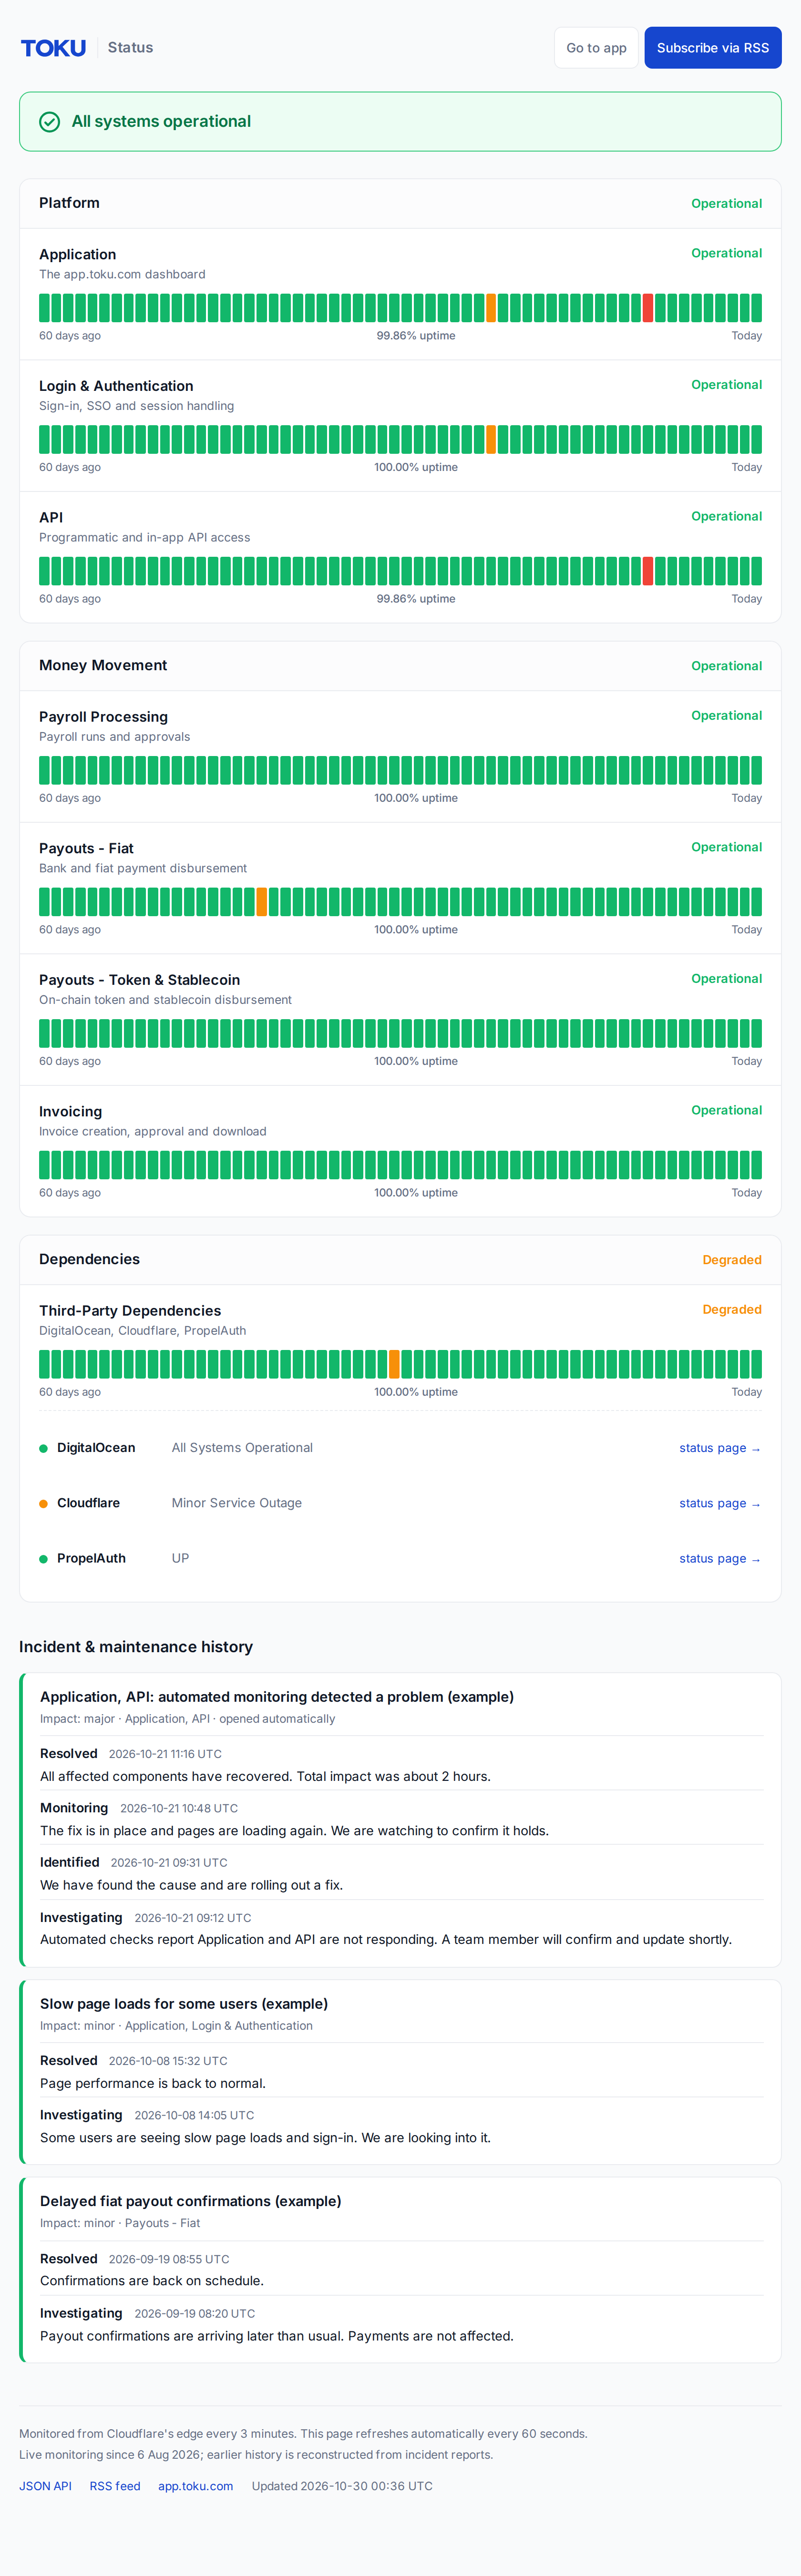
1. The banner at the top
The big colored banner is the one-glance answer. There are four states:

Green - All systems operational. Everything is working. If you are seeing a problem while the banner is green, the issue is likely specific to your account. Email [email protected] as usual.

Amber - Some systems are degraded. Something is slow or partly affected, but the platform is usable. Scroll down to see which part, and check the active incident for details.

Red - Major system outage. A part of the platform is down. An incident will be shown at the top of the page with updates as we work on it.

Amber - Scheduled maintenance in progress. We are doing planned work. This is expected and announced in advance.
2. The status label on each product area
The page lists each part of the platform in three groups: Platform (the app, login, API), Money Movement (payroll, payouts, invoicing), and Dependencies (outside services we rely on). Each row has a status label on the right:
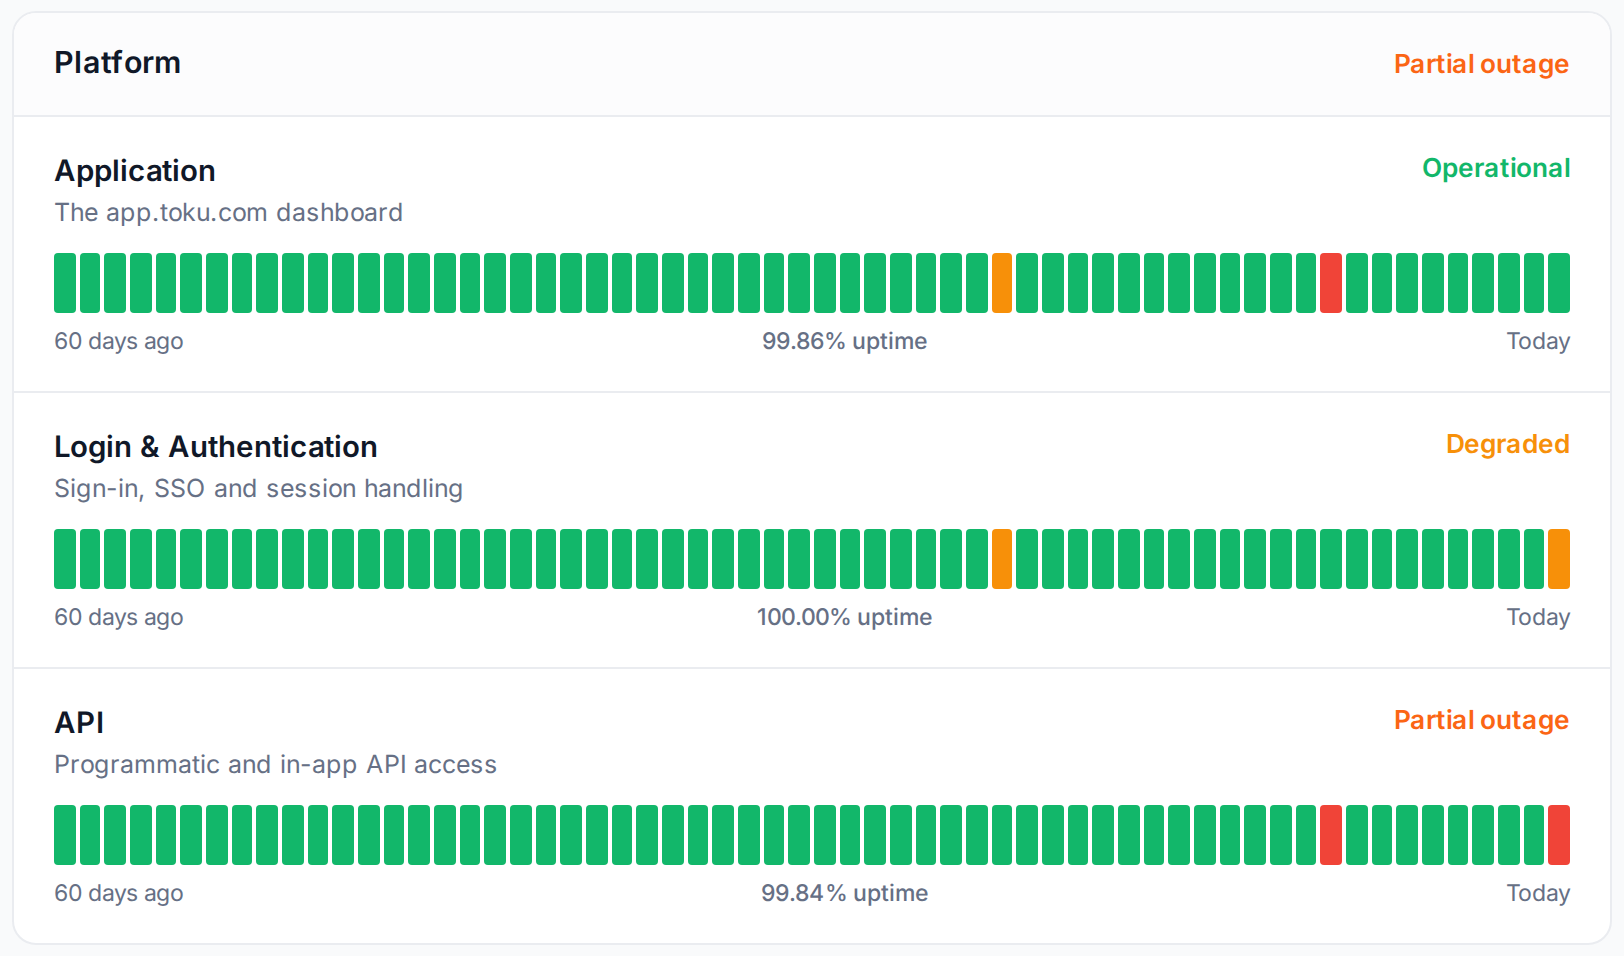
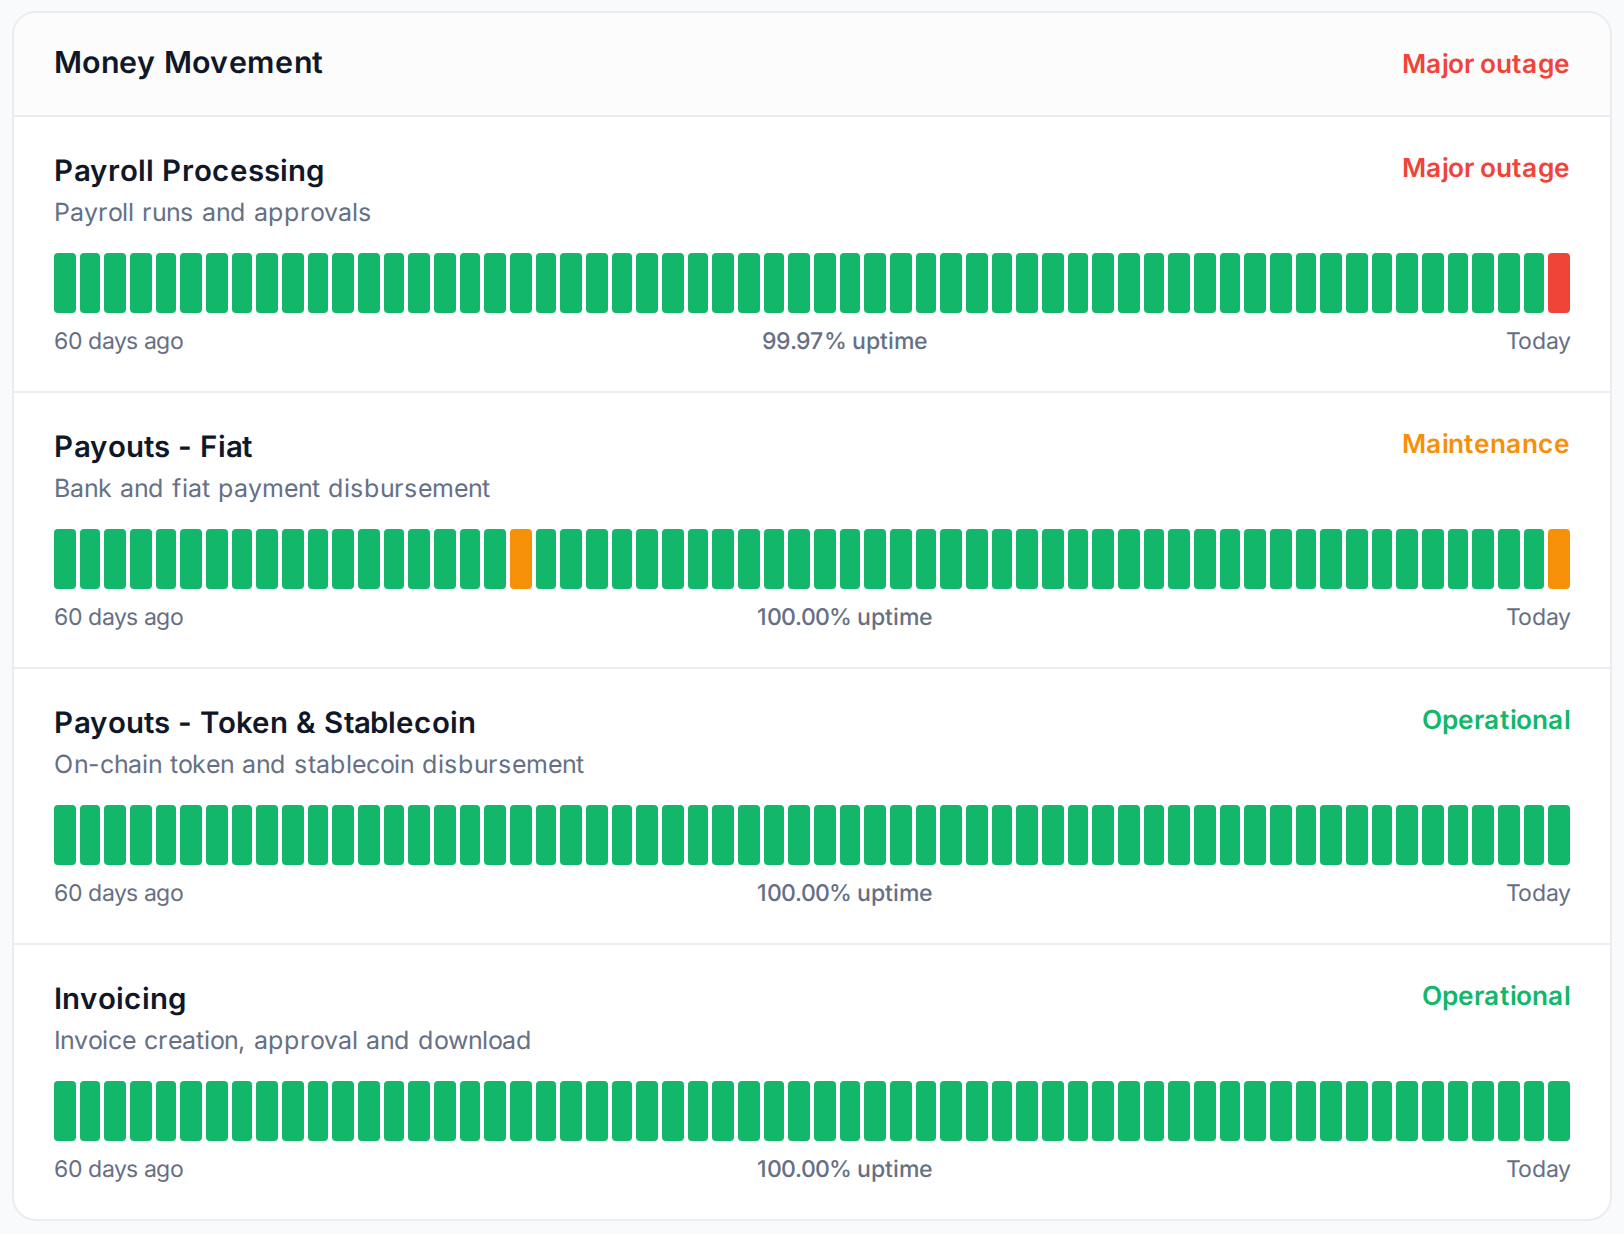
(These two screenshots are staged examples so you can see every label. They are not a real outage.)
What each label means:
- Operational (green) - working normally.
- Degraded (amber) - working, but slower than normal or with intermittent errors. Usable, but expect some friction.
- Partial outage (orange) - broken for some users or some functions, working for others.
- Major outage (red) - not working. This is what "down" looks like.
- Maintenance (amber) - temporarily paused on purpose for planned work.
3. The colored history bars
Under every row is a bar showing the last 60 days. Each small block is one day: green = normal, amber = some slowness that day, red = an outage happened that day.
Important: a red block does not mean the whole day was down. Hover over (or tap) any block to see exactly what happened: the date, how long the problem lasted, and which incident it was:
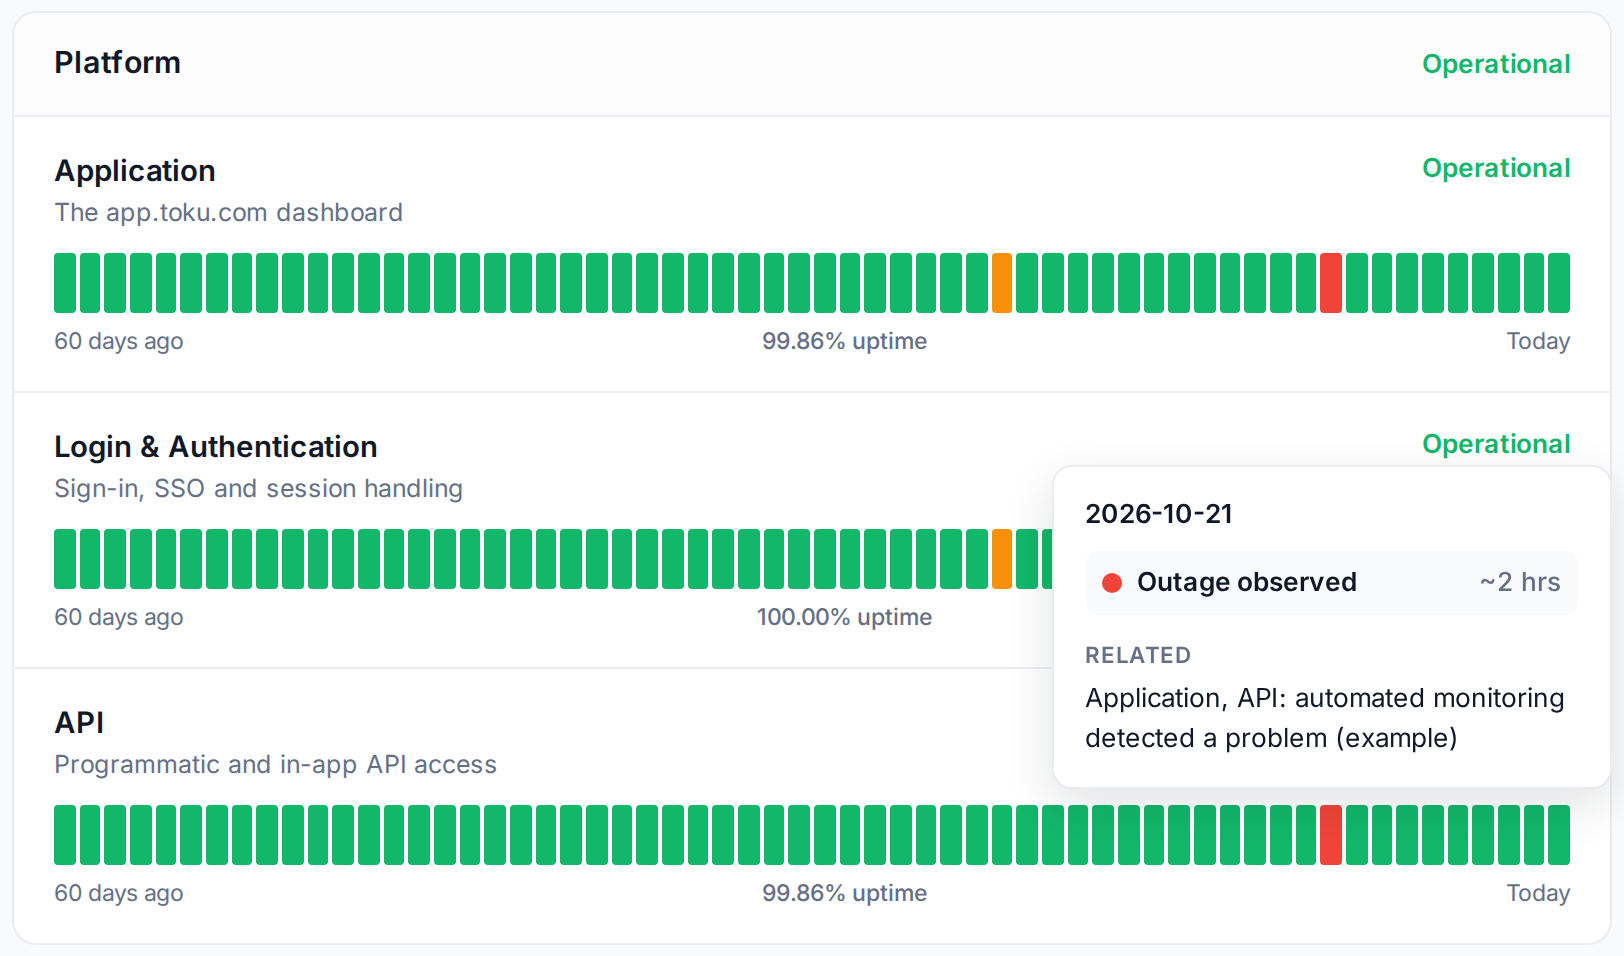
In this example, the red day had about 2 hours of impact, linked to a named incident. Another red day might be only a few minutes. Always hover before drawing conclusions.
4. Third-party services
Toku runs on outside providers (hosting, network, login services). The Dependencies section shows their live status with a link to each provider's own status page:
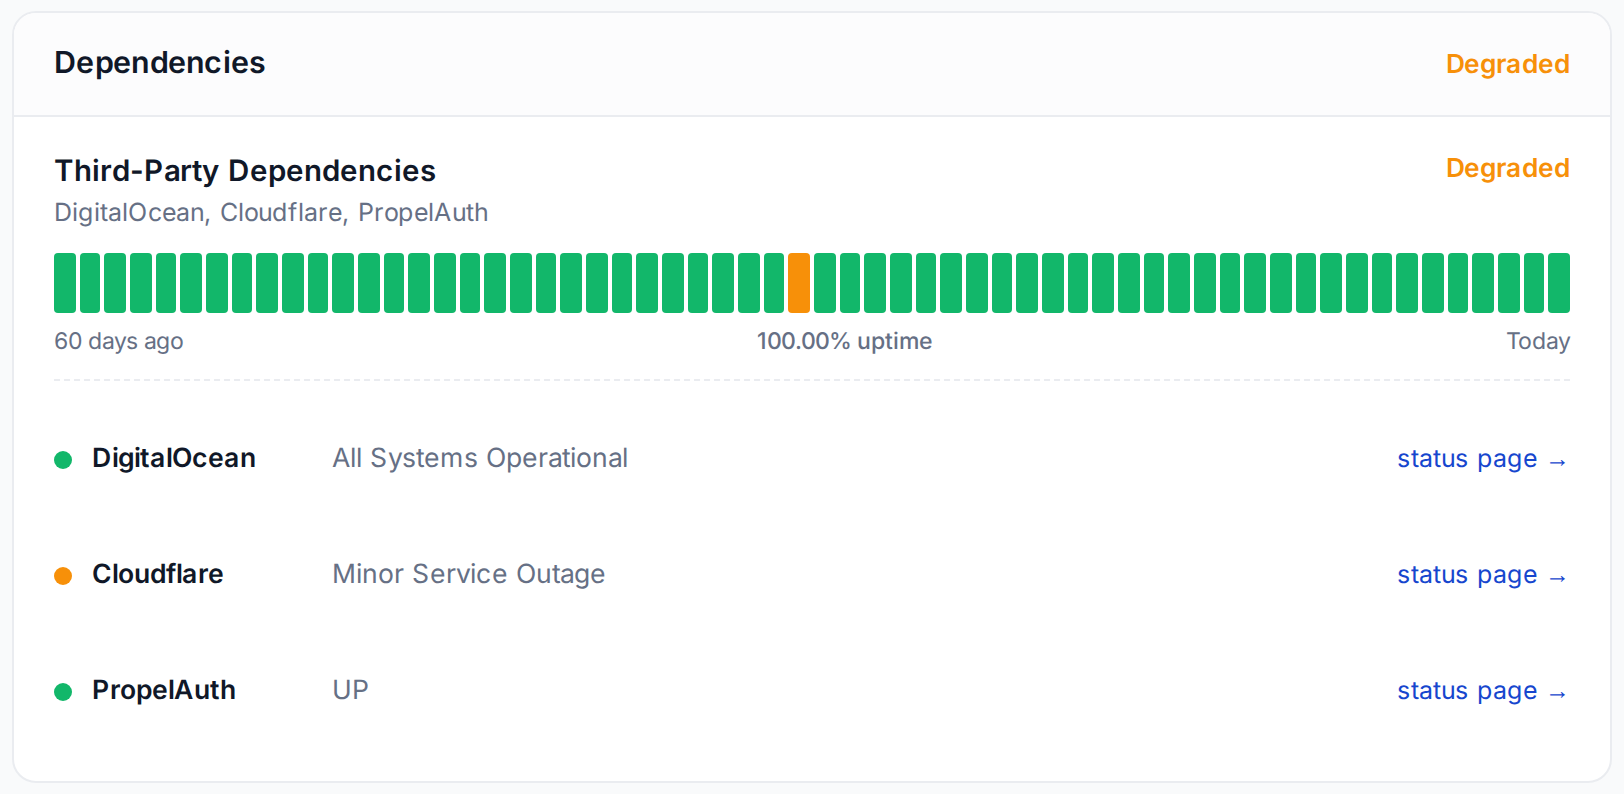
If a dependency shows a problem but Toku's own rows are green, the platform is fine. We are just watching a supplier's issue closely.
5. Incidents - what they look like and what the stages mean
When something breaks, an Active incident appears near the top of the page:
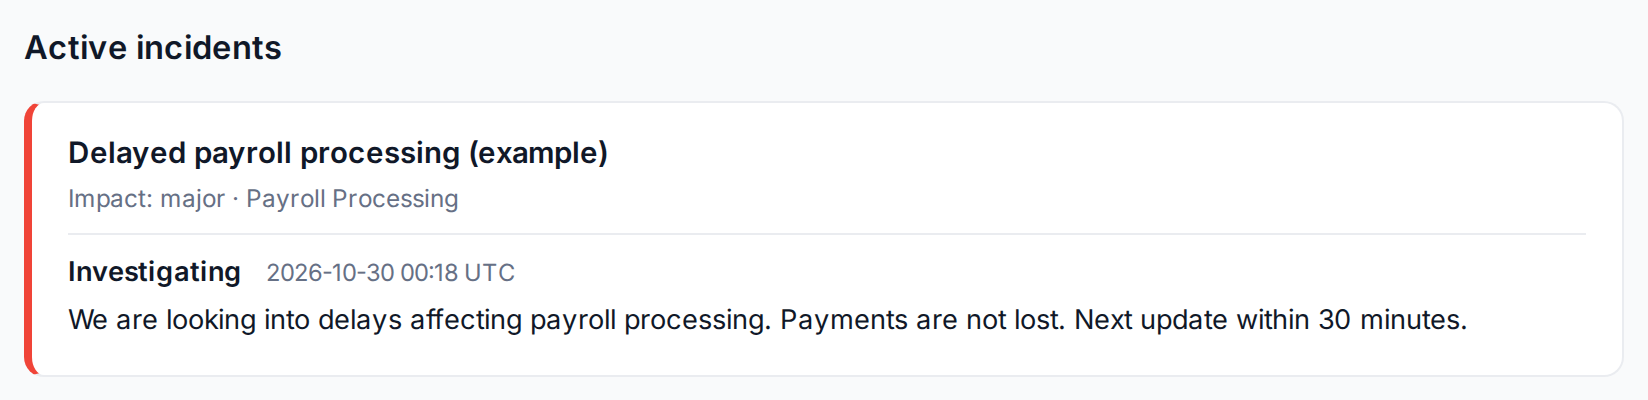
(Staged example for this guide.)
Every incident moves through up to four stages, each with a timestamped update:
- Investigating - we know something is wrong and are looking into it.
- Identified - we know the cause and are working on the fix.
- Monitoring - the fix is in; we are watching to confirm it holds.
- Resolved - fixed and confirmed. The incident moves into the history below. Some incidents are opened automatically by our monitoring within minutes of a failure. These say "opened automatically" and a person then confirms and adds details. Past incidents stay on the page permanently under Incident & maintenance history:
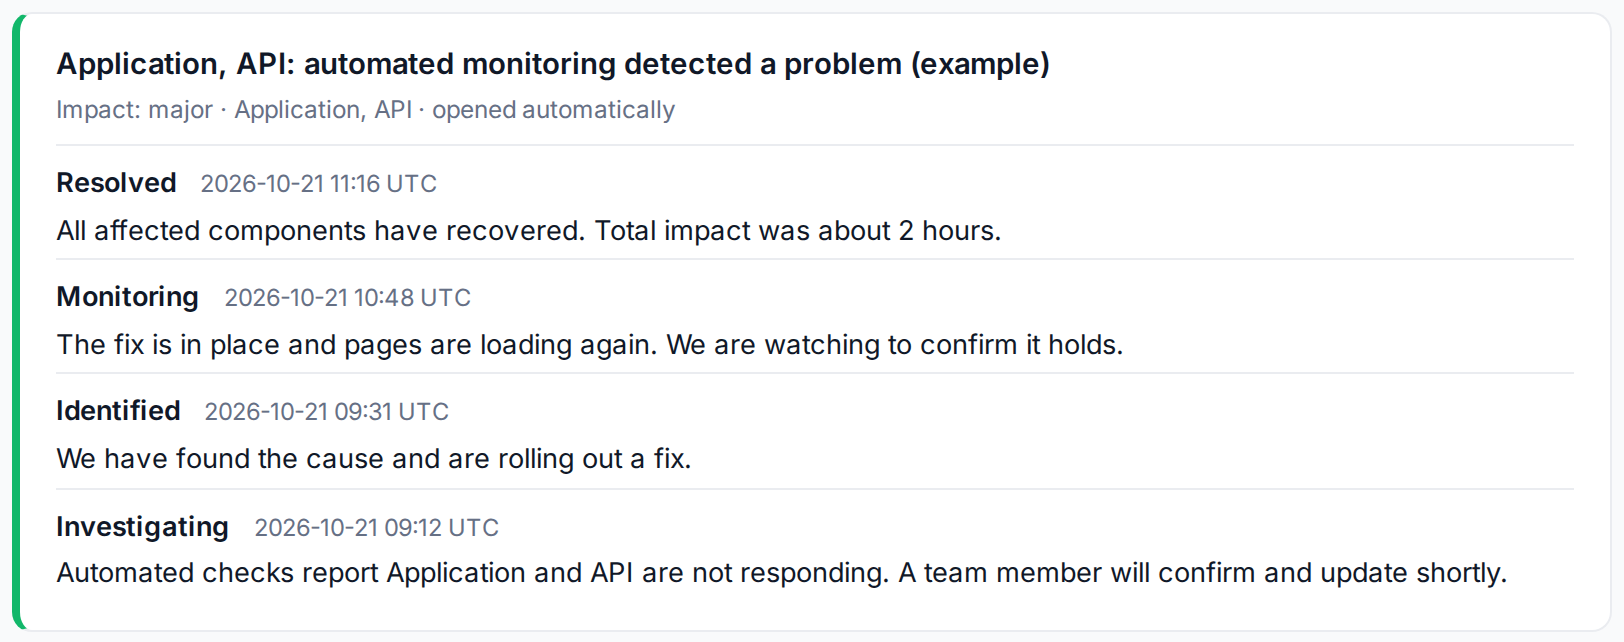
During an incident: keep status.toku.com open. Each update shows which stage we are in and when the next update is expected. You do not need to raise a separate ticket for an incident that is already posted.
6. Getting updates automatically
- The page refreshes itself every 60 seconds. Just leave it open during an incident.
- Subscribe via RSS (button at the top right) delivers every incident update to any RSS reader or tool that supports feeds.
- One note on history: live monitoring started on 6 August 2026. Earlier history was reconstructed from our internal incident records, as the page footer says.
Quick answers
- "Toku feels down but the page is all green." The platform-wide checks pass, so the issue is likely specific to your account. Email [email protected] with a screenshot and we will look into it.
- "There's a red block in the history. Was there a big outage?" Hover over it. It shows the real duration, sometimes hours, sometimes a few minutes.
- "Do I need an account to see the page?" No. It is public. Share the link freely with your team.
Still stuck?
You can email [email protected] to reach our support team. Please include your email address, organization name, and a description of what happened. Screenshots and videos are always welcome to speed up the troubleshooting process.